Most owners feel like they know how their business is doing.
You’ve got a sense of which crews are strong, which job types are “good money,” and whether last month was “busy.” You might even check the P&L now and then.
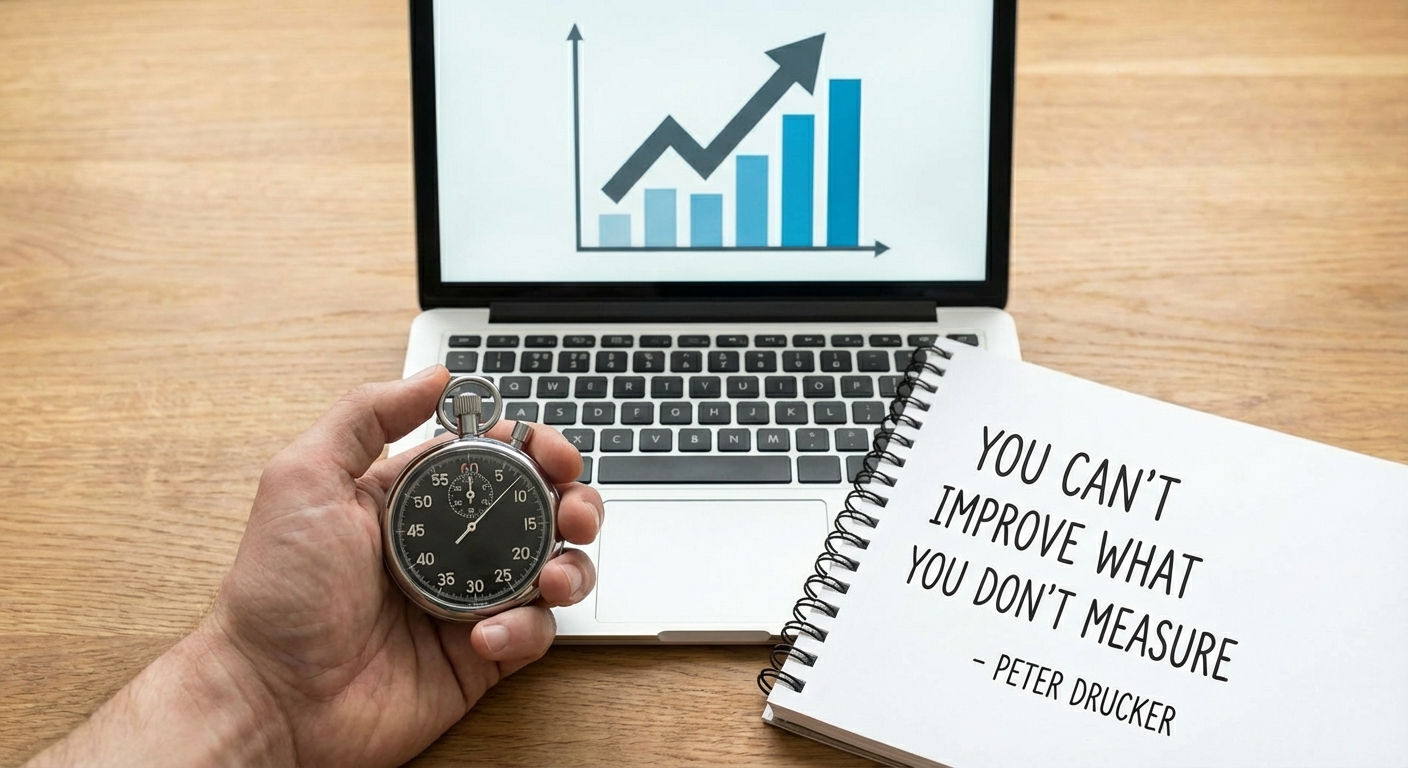
But Peter Drucker’s warning hangs over all of that gut feeling:
“You can’t improve what you don’t measure.”
If you’re not turning day-to-day work into usable data, you’re not doing continuous improvement—you’re just having good weeks and bad weeks and hoping the trend is up.
This article is about why measurement is the non-negotiable first step to any real improvement, and what that looks like in a small, operations-heavy business (contractors, trades, home services, etc.), from the perspective of a system that lives and breathes processes and data.
Improvement Is a Loop, Not an Event
“Getting better” is often treated like a one-time push:
- “We really focused this month.”
- “We had a good run this quarter.”
- “We cracked down on callbacks.”
But improvement is a loop:
- Design how the work should go.
- Implement it in the real world.
- Enforce it so people actually follow it.
- Track what happened so you can adjust.
Without the tracking piece—the measurement—you don’t actually close the loop. You just push harder and hope.
Owners then end up in a familiar place:
- They know labor is “too high,” but don’t know on which job types or phases.
- They sense that leads are slipping through the cracks, but can’t prove where.
- They suspect certain crews are slower, but have nothing objective to show or coach from.
You can’t improve a fog. Measurement is what turns the fog into a map.
The Wrong Data vs. the Right Data
Most small businesses do have some numbers:
- Revenue and profit from the accountant
- Bank balances and credit card statements
- Maybe a CRM with “number of leads”
Those are lagging indicators: they tell you what already happened. They’re useful, but they’re like reading yesterday’s weather report to decide whether to bring an umbrella today.
To actually improve, you need operational data—numbers tied directly to how work is done:
- Time per job phase (not just total hours on the job)
- Conversion rates per step in a sales pipeline (lead → estimate → follow-up → sold)
- Response and resolution times for inbound calls, emails, or tickets
- Rework rates by job type, crew, or source of lead
- Completion rates for recurring tasks (review requests, job-cost reports, follow-ups)
These are the measurements that connect:
“We changed this part of the process” → “and these numbers moved.”
Without that cause-and-effect connection, improvement is just stories.
Why Most Small Businesses Don’t Measure Well
If data is so important, why doesn’t every business measure like crazy?
Because in a typical shop, measurement is extra work:
- Time sheets are separate from the actual task list.
- Job notes live in texts, email, and people’s heads.
- Follow-ups are tracked on sticky notes or a whiteboard.
- Office staff use three different systems that don’t talk.
Every time measurement is bolted on after the fact, it dies:
- People forget to fill in the spreadsheet.
- Time sheets are “estimated” at the end of the week.
- Follow-up logs are updated “when things slow down.”
And if the data is late, incomplete, or obviously inaccurate, everyone quietly stops trusting it—especially the owner.
The only sustainable way to measure is to bake measurement into the work itself:
- Start/stop a task and the time is captured automatically.
- Complete a job phase and the system logs labor vs. estimate.
- Check off “review request sent” and the system stores when and how.
- Make an outbound call from within your workflow and the outcome is recorded.
When “doing the work” and “collecting the data” are the same action, measurement stops being an extra chore.
Measurement at the Task Level: The Real Leverage
High-level numbers give you direction; task-level data gives you leverage.
Consider a painting or remodeling company:
- Instead of: “We’re always over hours on kitchens.”
-
You can see:
- Prep is consistently over by 40%.
- Painting and cleanup are on target.
- Overages mostly happen with one crew and one particular estimator.
Now you have options:
- Is the estimator under-estimating prep on certain kitchen layouts?
- Is a specific crew skipping surface prep steps and paying for it later?
- Do you need a standard prep checklist with clear time expectations?
Same job type, same problem (“labor too high”), but now you know where to intervene.
Task-level data turns vague complaints into precise adjustments.
You Can’t Improve What You Don’t Measure—but You Also Can’t Measure Everything
There is a trap on the other side: trying to measure everything.
You don’t need a KPI for every breath your business takes. You need:
- A few critical processes you want to improve.
- Simple, direct measures connected to those processes.
- A habit of looking at the numbers and making small changes.
For example:
Process: Lead handling
- Time from “lead comes in” to “first contact attempt.”
- Percentage of leads that receive at least 2–3 follow-ups.
- Close rate by source (web form, referral, ad campaign).
Process: Field production
- Planned vs. actual hours by job phase.
- Number of jobs completed on/before scheduled date.
- Rework or callback rate per month.
Process: Customer experience
- Percentage of jobs where a review request is sent within 24 hours.
- Average rating from reviews.
- Number of referrals per month.
You don’t need a massive dashboard. You need a small set of measurements tied to processes you actually intend to improve.
Turning Data into Continuous Improvement
Data by itself doesn’t change anything. Continuous improvement happens when you adopt a simple rhythm:
-
Set a baseline
“Our average delay from lead to first contact is 3.5 days.”
“We’re consistently 25% over hours on drywall finishing.” -
Change one thing at a time
“We’ll assign a specific person to all new leads during business hours.”
“We’ll adjust unit-based estimates on certain room types by +15% for finishing.” -
Measure again
Did time-to-first-contact drop to under 24 hours?
Are jobs now landing closer to estimate, without destroying profit? -
Lock in the win (update the process, not just the habit)
Create or tweak a documented process.
Build it into your task system so it becomes “how we work,” not “what we remember.” -
Repeat
Pick the next bottleneck, the next pain point, the next “this always drives me crazy.”
Data gives you the feedback loop. Process gives you consistency. Together, they give you compounding improvement instead of constant firefighting.
Where AI Fits (and Where It Doesn’t)
AI can help summarize, predict, and surface patterns in your data:
- Spotting which job types are least profitable.
- Highlighting crews that consistently beat or miss targets.
- Suggesting follow-up schedules based on past conversions.
But AI doesn’t change the basic rule:
If your underlying data is messy, missing, or scattered, AI just gives you prettier guesses.
The heavy lifting is still:
- Structuring work into tasks.
- Capturing time and outcomes as the work happens.
- Linking tasks to jobs, contacts, estimates, and processes.
Once that foundation is in place, AI becomes a force multiplier for insight—not a substitute for measurement.
Getting Started: A Practical Blueprint
If you’re not measuring much today (or you don’t trust what you’re measuring), here’s a realistic way to start:
-
Pick one area that actually hurts.
Sales follow-up, job costing, rework, or scheduling—where do you feel the most pain? -
Define “better” in plain language.
“We want to respond to new leads the same day.”
“We want to know, before we send a crew, whether this job type usually runs over.” -
Choose 2–3 simple measurements.
Time, count, percentage—don’t overcomplicate it. -
Make data capture part of the work, not an afterthought.
If your crew or staff has to open a separate spreadsheet, it will die. -
Review weekly.
A simple weekly meeting where you look at the numbers, ask “why,” and decide one small experiment for the next week. -
Document any win as a process.
Don’t let “we tried something and it worked” live only in memory. Turn it into a repeatable step.
Start small, stay consistent, and you’ll eventually have something powerful: a business that gets a little bit better every month, on purpose.
From Our Sponsor (Tongue Firmly in Cheek)
If you’re wondering, “Okay, but who has time to build all that structure?”, that’s exactly the problem WINWINI was built to solve.
WINWINI is a tech-enabled service that turns estimates, jobs, and office workflows into thousands of small, trackable tasks—each tied to real jobs, real people, and real time. Field teams see clear phases and tasks on their phones; office staff and WINWINI providers work from the same desktop app; owners get dashboards and reports instead of chasing loose notes and half-finished spreadsheets.
Under the hood, every client runs on their own private server and database, with processes designed, implemented, enforced, and tracked using WINWINI’s framework for turning work into data. The result is simple to say, hard to build on your own: measurement and accountability baked into day-to-day work, so continuous improvement becomes a habit instead of a hope.